What Link to Microsoft Fabric Actually Costs: Dataverse Storage and Capacity Units
Link to Fabric has two cost components: the Delta replica held in Dataverse database capacity, and the Fabric capacity that consumes it. This covers both, with measured replica-to-source size ratios from a D365 F&O sandbox, current per-GB and per-SKU rates, and the levers that reduce consumption.
Link to Fabric removes the need to provision a storage account and build an export pipeline. It does not remove the storage itself: the replica is held in Dataverse database capacity, which is billed per GB per month at a substantially higher rate than lake storage. This post covers the full cost model, measured replica ratios, and the levers that reduce consumption.
#The two cost components
Cost estimates for Link to Microsoft Fabric commonly account for Fabric capacity alone, because that is the component with a public price list. Dataverse storage consumption is the second component and is frequently omitted.
The cost model is:
- Dataverse database capacity — the Delta replica of every synced table is held in Dataverse storage, billed per GB per month.
- Fabric capacity (CUs) — everything you do with the data once it's in OneLake: notebooks, pipelines, SQL endpoint queries, Direct Lake semantic models.
The second component behaves like any other Fabric workload and is well documented. The first is the one worth measuring before committing to a table set.
#Where the replica shows up
Link to Fabric doesn't copy your data into OneLake. It creates an optimised Delta Parquet replica using Dataverse storage, then exposes it to your Fabric workspace through shortcuts. The data stays governed by Dataverse and stays in the same region as the environment.
You can see exactly what it costs you. Start with the environment-level totals:
- Go to the Power Platform admin center.
- Licensing → Capacity add-ons → Dataverse tab.
- The grid gives you Database usage, File usage, and Log usage per environment. Fabric Link replicas land in Database usage.
- The Details control on the environment row opens the consumption trend, which is what you want when you're trying to spot the step change a new link introduced.
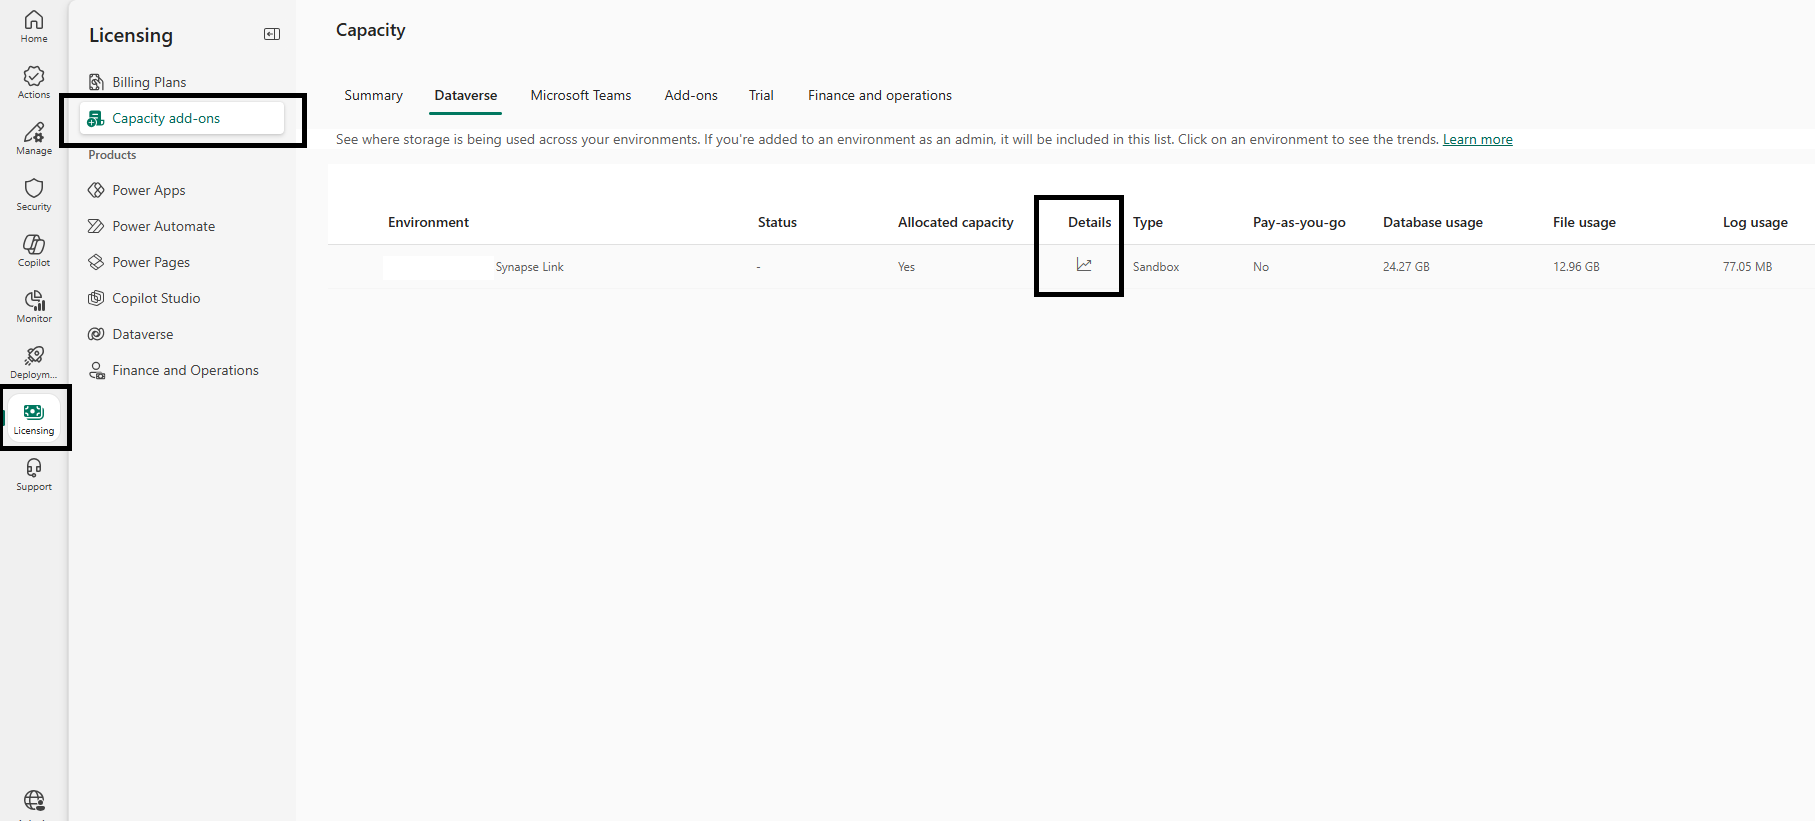
Environment totals tell you whether you have a problem. They don't tell you which tables caused it. For that there is now a per-table view:
- Licensing → Dataverse (under Products) → Environments tab.
- Scroll to Consumption per table.
- Type
Analyticsinto the search box. - Sort by Consumption, and use Download report if you want the full list rather than the page you can see.
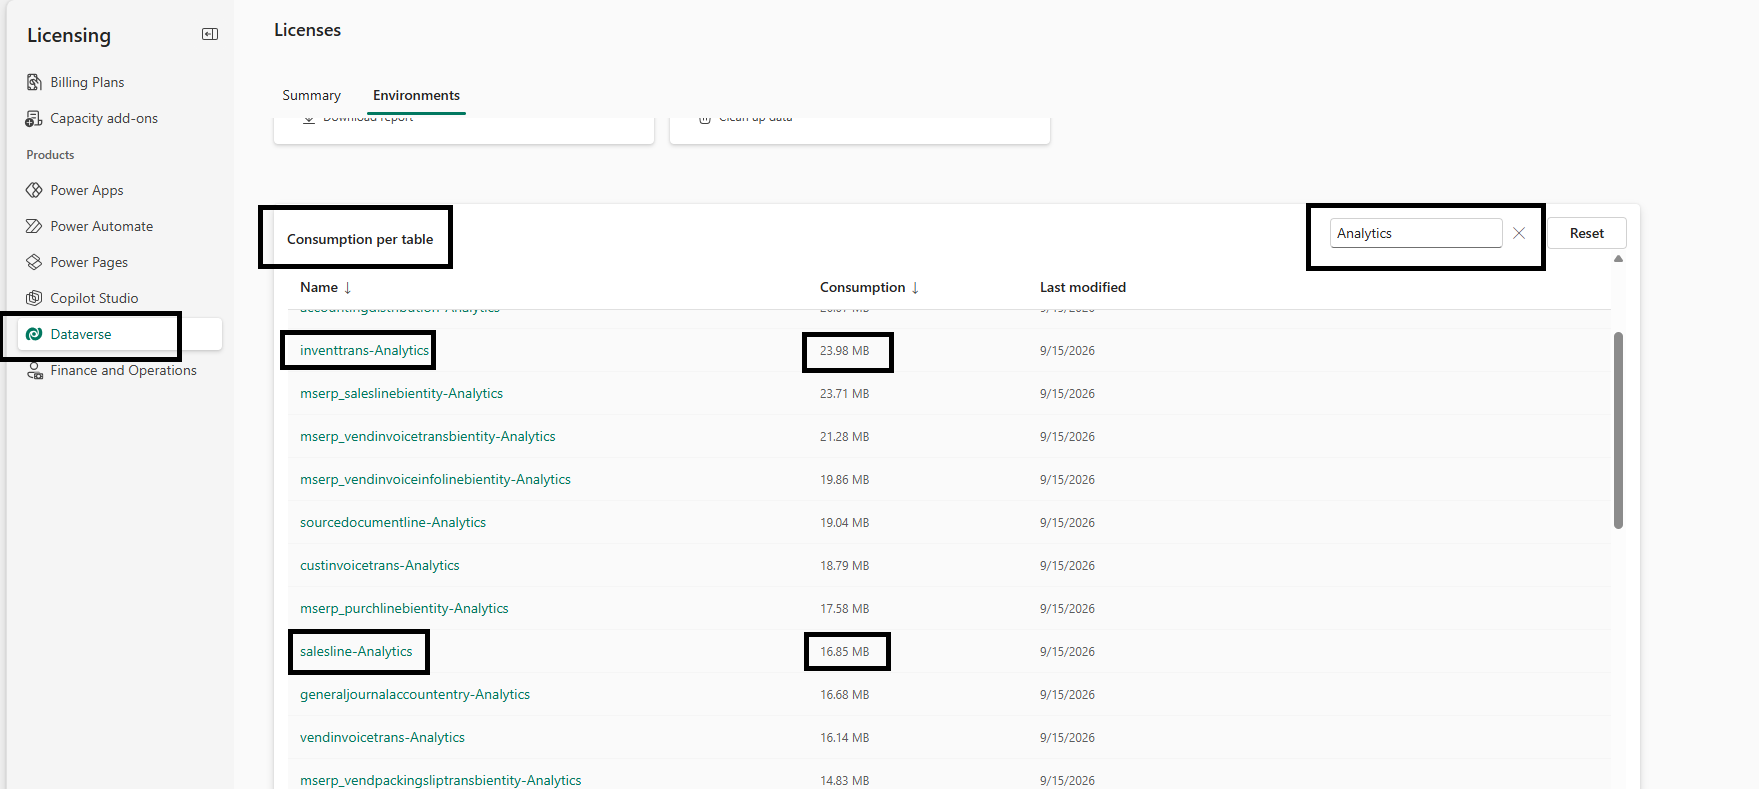
Every table with an -Analytics suffix is the Fabric Link replica. If you linked the Account table, you'll find an Account-Analytics entry alongside it. The Last modified column is useful on its own — a replica that hasn't moved in weeks is a table nobody is writing to, and often one nobody is reading either.
Microsoft's capacity documentation notes the
- Analyticssuffix is also used by Insights applications, so on an environment running Sales Insights or Field Service analytics you'll see entries that aren't from Fabric Link. Cross-reference against your linked table list rather than assuming.
#Finding the F&O source table sizes
The -Analytics figure is only half of a ratio. To size a link before you create it — or to work out which tables are actually driving replica growth — you need the source side, and for finance and operations environments that lives on a separate tab:
- Licensing → Capacity add-ons → Finance and operations tab.
- Select the environment.
- The flyout lists every F&O table with its size, sorted descending.
- Use Export to CSV for the full list; View as chart shows only the top consumers, which is insufficient for a full accounting.
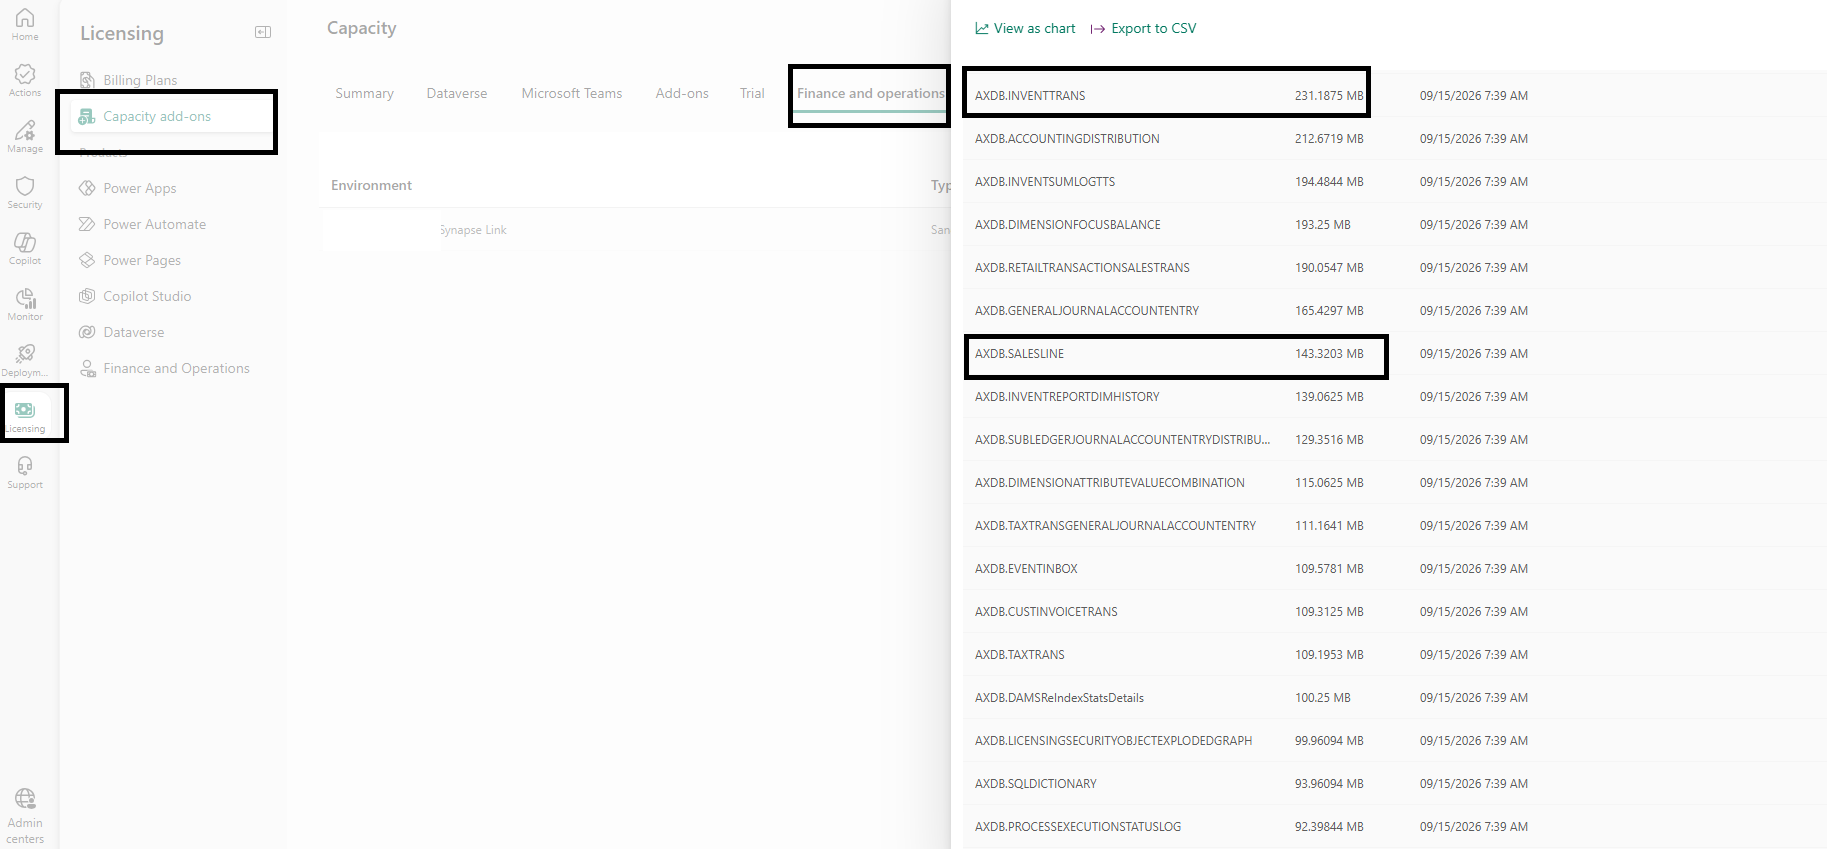
F&O tables appear with an AXDB. prefix in upper case. To join the two lists, strip the prefix and lower-case the name: AXDB.INVENTTRANS on the F&O tab is inventtrans-Analytics on the Dataverse tab. Data-entity-backed tables carry an mserp_ prefix on the Dataverse side — mserp_saleslinebientity-Analytics, mserp_purchlinebientity-Analytics — and have no single AXDB. counterpart, so exclude them from ratio calculations rather than guessing at a match.
With both CSVs exported you can compute the replica ratio per table yourself, which is the input to every decision in the rest of this post.
#Measured replica ratios
The compression ratio of the replica is not documented. The following figures were measured on a Dynamics 365 Finance and Operations sandbox, joining the two exports above — F&O source table size against the size of the Dataverse analytics replica the same table produced:
| Table | Source size (MB) | Analytics replica (MB) | Replica as % of source |
|---|---|---|---|
AXDB.INVENTTRANS |
231.2 | 24.0 | ~10% |
| Large batch history table | 1,504.4 | 160.5 | ~11% |
AXDB.SALESLINE |
143.3 | 16.9 | ~12% |
| Small sales header table | 2.0 | 1.3 | ~65% |
Two observations follow from this data.
For large tables, budget roughly 10–12% of source size. Delta Parquet's columnar compression is effective at this scale. A terabyte of F&O tables lands in the region of 100–120 GB of Dataverse database capacity.
For small tables, the ratio degrades significantly. The 2 MB table produced a 1.3 MB replica — 65%, not 10%. Compression has limited data to work with, and the fixed overhead of Delta file and transaction-log structures becomes proportionally dominant. Below a certain table size, most of the consumption is structural rather than data.
The operational consequence is that selection discipline should be applied to the low-volume tables, not only the high-volume ones. A few hundred small tables syncing at a near-1:1 ratio can represent meaningful consumption for data that is never queried. Per-table selection has more effect than total source volume.
Measure your own ratios before you extrapolate — these are from one sandbox, and yours will differ with column count, data types, and churn.
#Storage rates by tier
The per-GB rate differs by three orders of magnitude depending on where a gigabyte of Delta Parquet is held:
| Storage | Price per GB per month |
|---|---|
| OneLake — cold | $0.0050 |
| OneLake — cool | $0.0125 |
| OneLake — hot | $0.023 |
| Fabric SQL storage | $0.25 |
| Dataverse database capacity | ~$40 (list) |
Fabric and OneLake prices checked on the Azure Microsoft Fabric pricing page, 14 September 2026, US region. Dataverse database capacity is the published list rate from the Power Platform and Dynamics 365 licensing guides — verify the current figure for your agreement, since capacity add-on pricing isn't published on a public Learn page.
At list rates, a replica costing approximately $1.15/month in OneLake hot storage corresponds to approximately $2,000/month as Dataverse database capacity.
#The Fabric capacity component
This component is publicly priced. Capacity is sold in CUs:
| SKU | CUs | Pay-as-you-go | 1-year reservation |
|---|---|---|---|
| F2 | 2 | $262.80/mo | $156.33/mo |
| F4 | 4 | $525.60/mo | $312.67/mo |
| F8 | 8 | $1,051.20/mo | $625.33/mo |
| F16 | 16 | $2,102.40/mo | $1,250.67/mo |
| F32 | 32 | $4,204.80/mo | $2,501.33/mo |
| F64 | 64 | $8,409.60/mo | $5,002.67/mo |
| F128 | 128 | $16,819.20/mo | $10,005.33/mo |
| F256 | 256 | $33,638.40/mo | $20,010.67/mo |
Prices checked 14 September 2026, US region. Reservation saves roughly 41% over pay-as-you-go. SKUs now run up to F4096 and F8192.
Three points that aren't on the price list:
- Reservation discounts don't apply to every billing mode. Autoscale Billing for Spark bills at standard pay-as-you-go CU-hour rates, as does Fabric capacity overage. Reserving base capacity discounts neither.
- Pausing reduces cost for non-production capacities. A paused capacity stops billing compute. Note that pausing affects Fabric workloads only — it does not reduce the Dataverse storage component.
- Region affects the rate. Capacity pricing varies by region, and Link to Fabric requires the capacity to be in the Dataverse environment's region, so region selection isn't available as a cost lever here.
#Cost levers, ranked by impact
1. Unselect tables that aren't queried. This has the largest effect on the storage component. Open Manage tables from the command bar on your Fabric link, clear the tables, and confirm. Unselected tables are removed from the internal storage that feeds the shortcuts, so consumption stops. Removing a table doesn't delete anything in Dataverse; it removes the OneLake shortcut and stops the sync. Some system tables and add-in-required tables can't be removed.
2. Audit the small-table long tail. Per the ratios above, low-volume tables consume proportionally more. Sort the capacity CSV by replica-size-to-source-size rather than by absolute size.
3. Avoid unnecessary relinks. Unlink-and-relink triggers a full initial sync of every configured table. That's a large, concentrated compute event. Batch your reasons for relinking rather than doing it repeatedly.
#A worked example
An F&O estate with 500 GB of candidate tables, of which you actually need 150 GB for operational reporting:
| Approach | Dataverse replica | Approximate monthly storage cost |
|---|---|---|
| Link everything (500 GB) | ~55 GB at 11% | ~$2,200 above entitlement |
| Link selectively (150 GB) | ~17 GB at 11% | ~$680 above entitlement |
| Selective + prune small-table tail | ~12 GB | ~$480 above entitlement |
The difference between the first and third rows is approximately $1,700/month in storage consumption alone. Note that the default behaviour of Link to Fabric is to add all non-system change-tracked tables, which corresponds to the first row.
#Summary & takeaways
- Fabric Link's cost is Dataverse database capacity + Fabric capacity. The storage component is the one commonly omitted from estimates.
- Find replica consumption per table in PPAC → Licensing → Dataverse → Environments → Consumption per table, filtered on the
-Analyticssuffix. Get the matching source sizes from Capacity add-ons → Finance and operations, where tables carry anAXDB.prefix. - Budget ~10–12% of source size for large tables. For small tables the ratio can reach 65%, so the long tail consumes proportionally more.
- Dataverse database capacity is approximately $40/GB/month list versus $0.023/GB/month for OneLake hot — a difference of roughly three orders of magnitude.
- The largest storage lever is unselecting tables via Manage tables. Enable CDF only where it's consumed; it costs storage, compute, and latency.
- Fabric capacity reservation saves ~41%, but not on Autoscale Billing for Spark or capacity overage.
#Sources
- Microsoft Fabric pricing — F SKU pay-as-you-go and reservation rates, ~41% reservation saving, OneLake hot/cool/cold storage rates, SQL storage rates, and the note that Autoscale Billing for Spark and capacity overage bill at pay-as-you-go rates without reservation discounts. Checked 14 September 2026.
- Dataverse capacity-based storage details — the capacity report structure,
- Analyticstables, cross capacity-type borrowing (Database → Log → File), the combined Dataverse and Operations database pool, overage enforcement scenarios, and the storage advisor preview. - Link your Dataverse environment to Microsoft Fabric — confirmation that Link to Fabric creates a Delta Parquet replica using Dataverse storage and increases Dataverse database storage consumption, and where to view it in the admin center.
- Configure your environment and link to Microsoft Fabric — the Manage tables surface, the fact that only selected tables consume storage, removal behaviour, Change Data Feed's ~24-hour retention and its performance tradeoff, and the region requirement.
- Capacity add-ons for Power Apps and Power Automate — how Dataverse storage add-ons accrue to tenant-level entitlements, and the licensing guide as the authoritative source for per-GB pricing.
#Related reading
- Azure Synapse Link Delta Lake Is Being Retired — the deprecation timeline that forces this decision, and how Fabric Link compares with Synapse Link CSV on everything other than cost.
- Implementing Change Data Feed for Incremental Processing in Microsoft Fabric Lakehouses — worth reading before you enable CDF on a Fabric link, so you enable it for a reason.
Get future articles
Follow for practical Microsoft Fabric, Azure, Spark, and data engineering writeups.